Edit chart
Loading graph
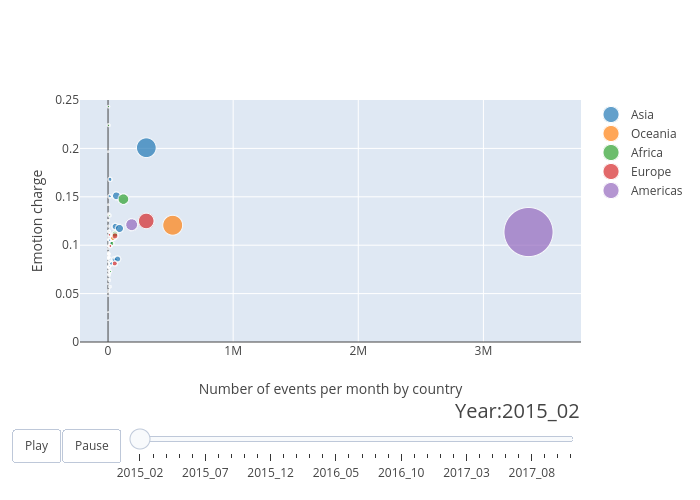
Studentuni's interactive graph and data of "Emotion charge vs Number of events per month by country" is a scatter chart, showing Asia, Oceania, Africa, Europe, Americas; with Number of events per month by country in the x-axis and Emotion charge in the y-axis.. The x-axis shows values from -207587.58328717042 to 3677835.001435044. The y-axis shows values from 0 to 0.25.