Edit chart
Loading graph
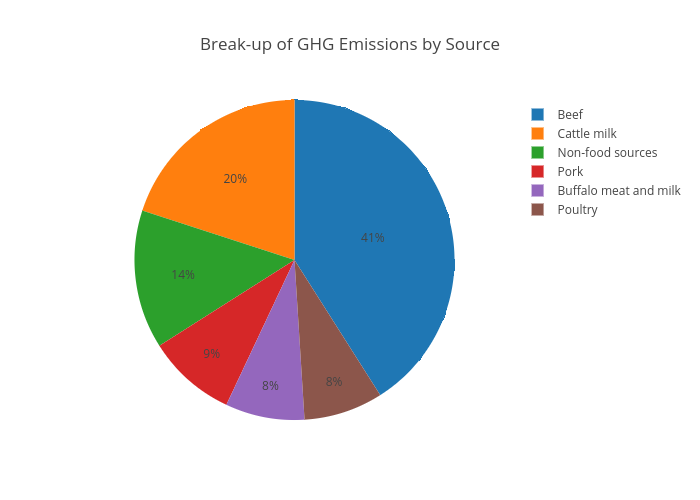
Swagam's interactive graph and data of "Break-up of GHG Emissions by Source" is a pie, showing B. The x-axis shows values from 0 to 0. The y-axis shows values from 0 to 0.