Edit chart
Loading graph
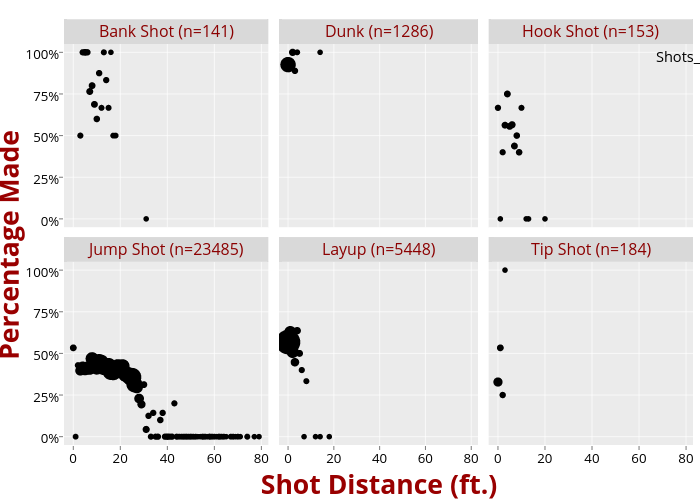
T.stokes's interactive graph and data of ", , , , , " is a scatter chart, showing , , , , , . The x-axis shows values from -3.95 to 82.95. The y-axis shows values from -0.05 to 1.05. This visualization has the following annotations: Shot Distance (ft.) ; Percentage Made ; Bank Shot (n=141); Dunk (n=1286); Hook Shot (n=153); Jump Shot (n=23485); Layup (n=5448); Tip Shot (n=184); Shots_in_Bin