Edit chart
Loading graph
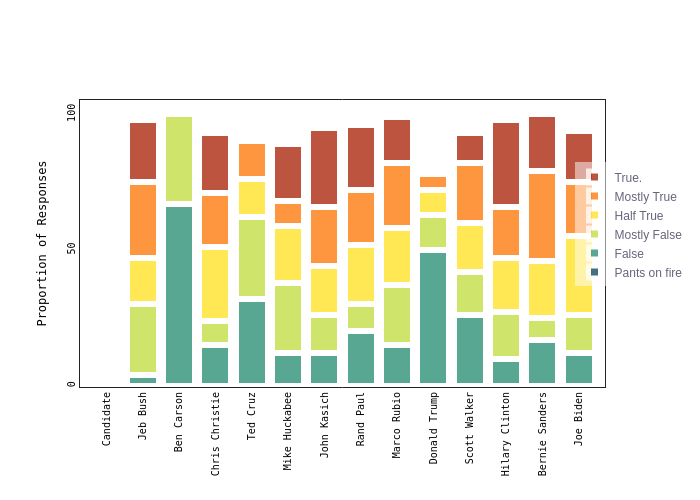
Tssfl's interactive graph and data of "{'font': {'size': 11, 'color': 'rgb(88, 74, 77)', 'family': '"Courier New", monospace'}}" is a stacked bar chart, showing Pants on fire, False, Mostly False, Half True, Mostly True, True.; with Proportion of Responses in the y-axis. The x-axis shows values from 0.5 to 20.5. The y-axis shows values from 0 to 106.3157894736842.