Edit chart
Loading graph
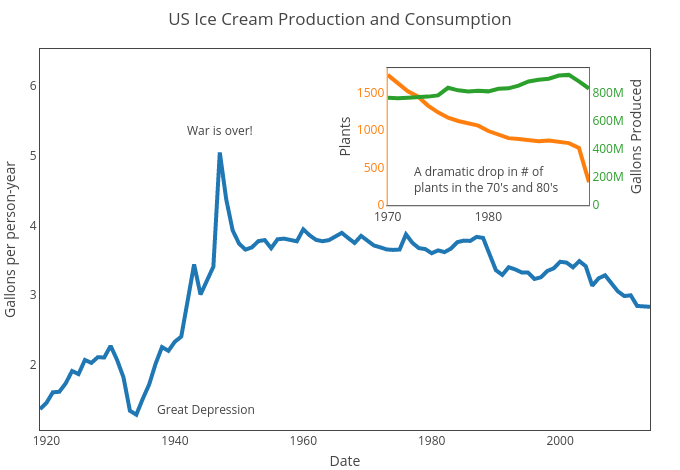
Tanisukegoro's interactive graph and data of "US Ice Cream Production and Consumption" is a line chart, showing Date, Date, Col3; with Date in the x-axis and Gallons per person-year in the y-axis.. The x-axis shows values from 1918-12-31 to 2013-12-31. The y-axis shows values from 1.0678028223627345 to 6.531981939780381. This visualization has the following annotations: War is over!; A dramatic drop in # ofplants in the 70's and 80's; Great Depression