Edit chart
Loading graph
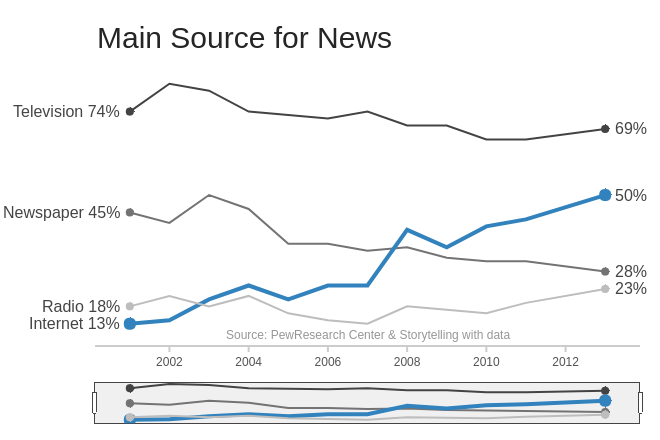
Tanisukegoro's interactive graph and data is a line chart; with in the x-axis. The x-axis shows values from 2000.1210191082803 to 2013.8789808917197. The y-axis shows values from 6.890625000000001 to 85.953125. This visualization has the following annotations: Television 74%; 69%; Newspaper 45%; 28%; Internet 13%; 50%; Radio 18%; 23%; Main Source for News; Source: PewResearch Center & Storytelling with data