Edit chart
Loading graph
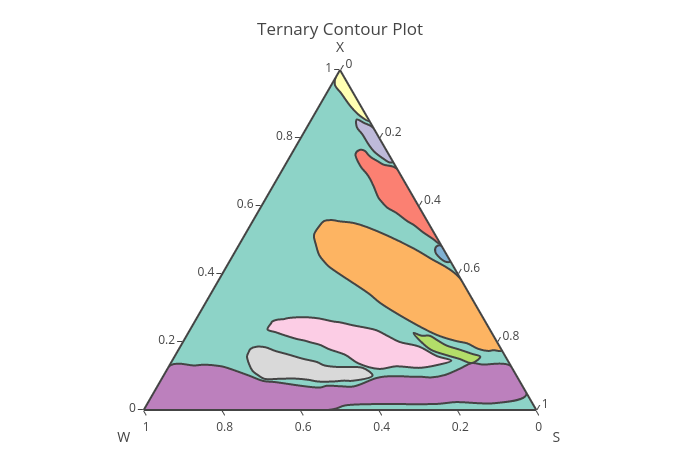
Tanisukegoro's interactive graph and data of "Ternary Contour Plot" is a filled scatterternary. The x-axis shows values from 0 to 0. The y-axis shows values from 0 to 0.