Edit chart
Loading graph
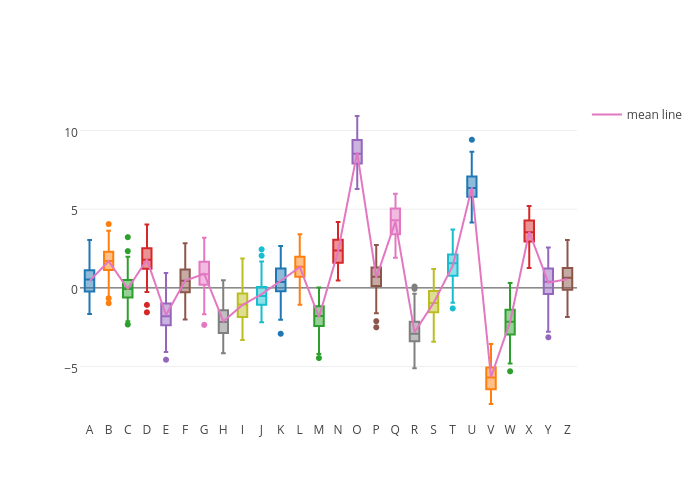
Tearon's interactive graph and data of "A, B, C, D, E, F, G, H, I, J, K, L, M, N, O, P, Q, R, S, T, U, V, W, X, Y, Z, mean line" is a box plot, showing A, B, C, D, E, F, G, H, I, J, K, L, M, N, O, P, Q, R, S, T, U, V, W, X, Y, Z, mean line. The x-axis shows values from 0 to 0. The y-axis shows values from 0 to 0.