Edit chart
Loading graph
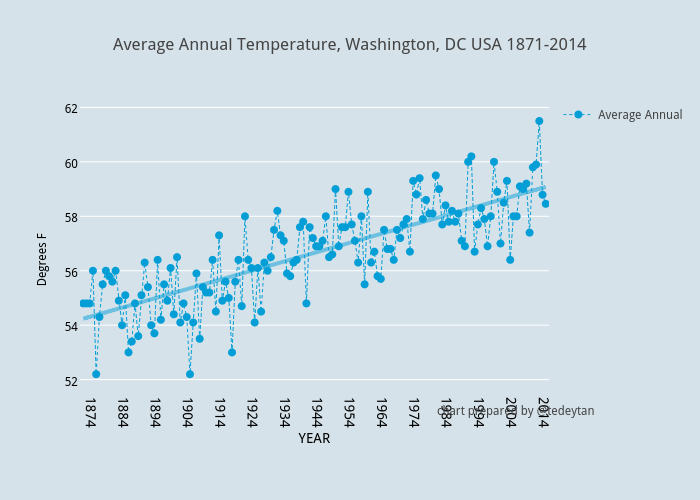
Tedeytan's interactive graph and data of "Average Annual Temperature, Washington, DC USA 1871-2014" is a line chart, showing Average Annual vs Average Annual - fit; with YEAR in the x-axis and Degrees F in the y-axis.. The x-axis shows values from 1870 to 2015. The y-axis shows values from 50.64791057608708 to 62.18819212717981. This visualization has the following annotation: chart prepared by @tedeytan