Edit chart
Loading graph
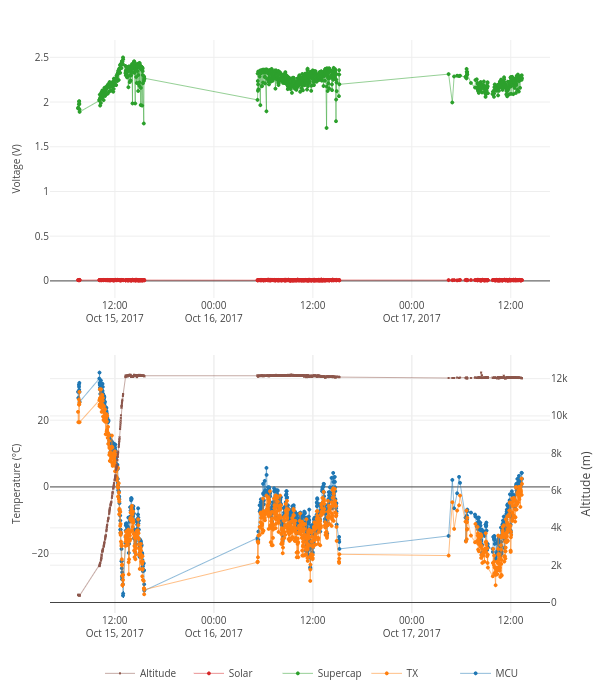
Tomastt7's interactive graph and data of "MCU, TX, Supercap, Solar, Altitude" is a line chart, showing MCU, TX, Supercap, Solar, Altitude; with Temperature (°C) in the y-axis. The x-axis shows values from 2017-10-15 04:07:37.4234 to 2017-10-17 16:45:35.5766. The y-axis shows values from -37.30310861920245 to 39.003108619202436.