Edit chart
Loading graph
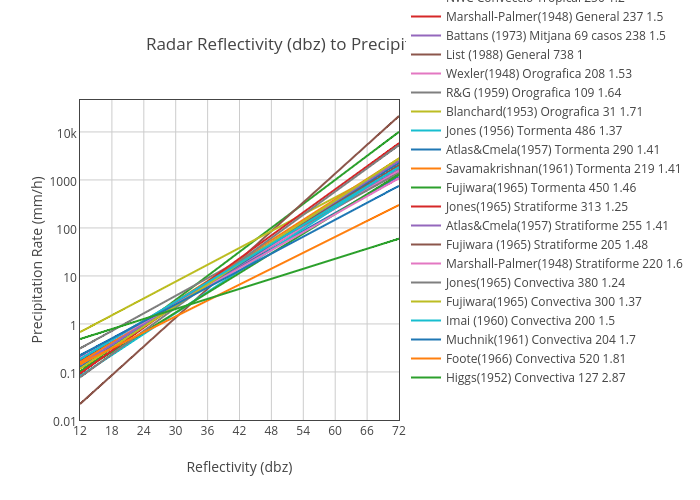
Tonibois's interactive graph and data of "Radar Reflectivity (dbz) to Precipitation Rate (mm/h)" is a scatter chart, showing AEMET General 200 1.6, NWC General 300 1.4, NWC Convecció Tropical 250 1.2, Marshall-Palmer(1948) General 237 1.5, Battans (1973) Mitjana 69 casos 238 1.5, List (1988) General 738 1, Wexler(1948) Orografica 208 1.53, R&G (1959) Orografica 109 1.64, Blanchard(1953) Orografica 31 1.71, Jones (1956) Tormenta 486 1.37, Atlas&Cmela(1957) Tormenta 290 1.41, Savamakrishnan(1961) Tormenta 219 1.41, Fujiwara(1965) Tormenta 450 1.46, Jones(1965) Stratiforme 313 1.25, Atlas&Cmela(1957) Stratiforme 255 1.41, Fujiwara (1965) Stratiforme 205 1.48, Marshall-Palmer(1948) Stratiforme 220 1.6, Jones(1965) Convectiva 380 1.24, Fujiwara(1965) Convectiva 300 1.37, Imai (1960) Convectiva 200 1.5, Muchnik(1961) Convectiva 204 1.7, Foote(1966) Convectiva 520 1.81, Higgs(1952) Convectiva 127 2.87; with Reflectivity (dbz) in the x-axis and Precipitation Rate (mm/h) in the y-axis.. The x-axis shows values from 12 to 72. The y-axis shows values from -2.001389684757846 to 4.665276970898644.