Edit chart
Loading graph
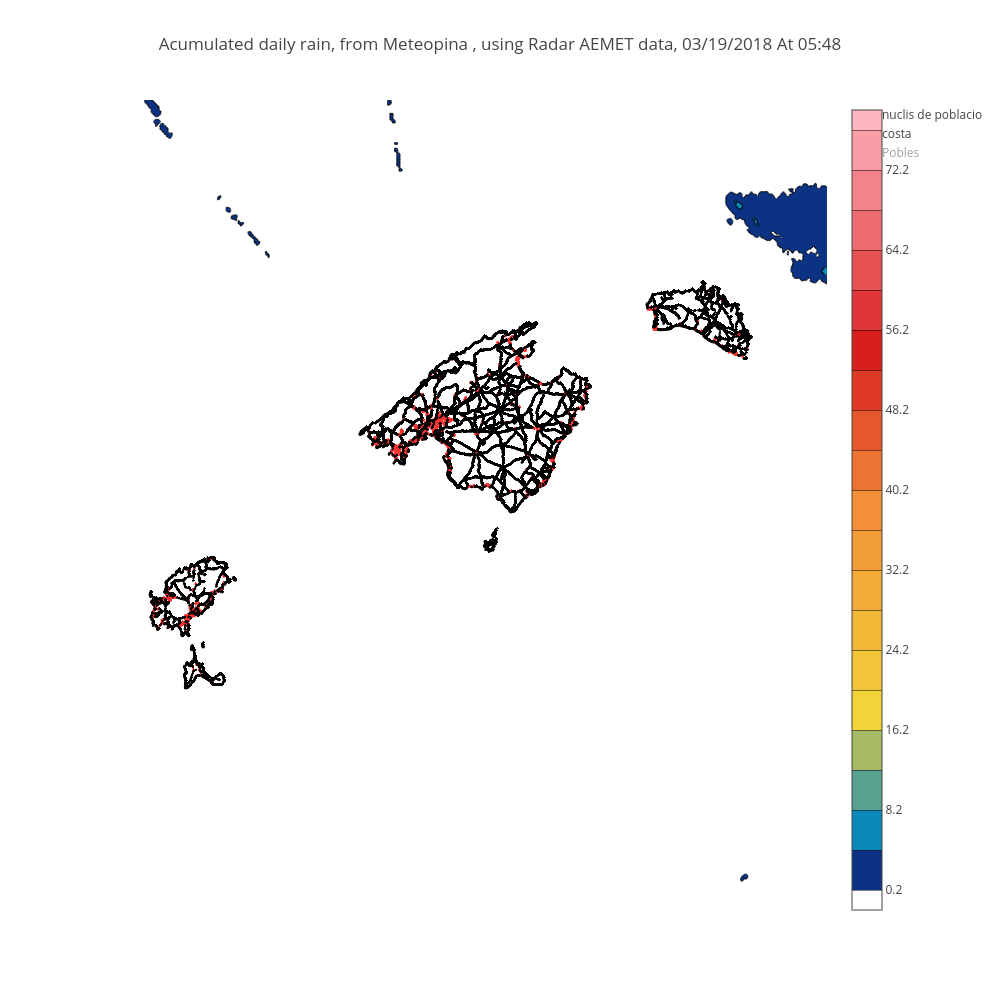
Tonibois's interactive graph and data of "Acumulated daily rain, from Meteopina , using Radar AEMET data, 02/23/2020 At 10:48 " is a scatter chart, showing nuclis de poblacio, costa, Pobles, Precipitacio_contorn. The x-axis shows values from 75 to 400. The y-axis shows values from 420 to 80.