Edit chart
Loading graph
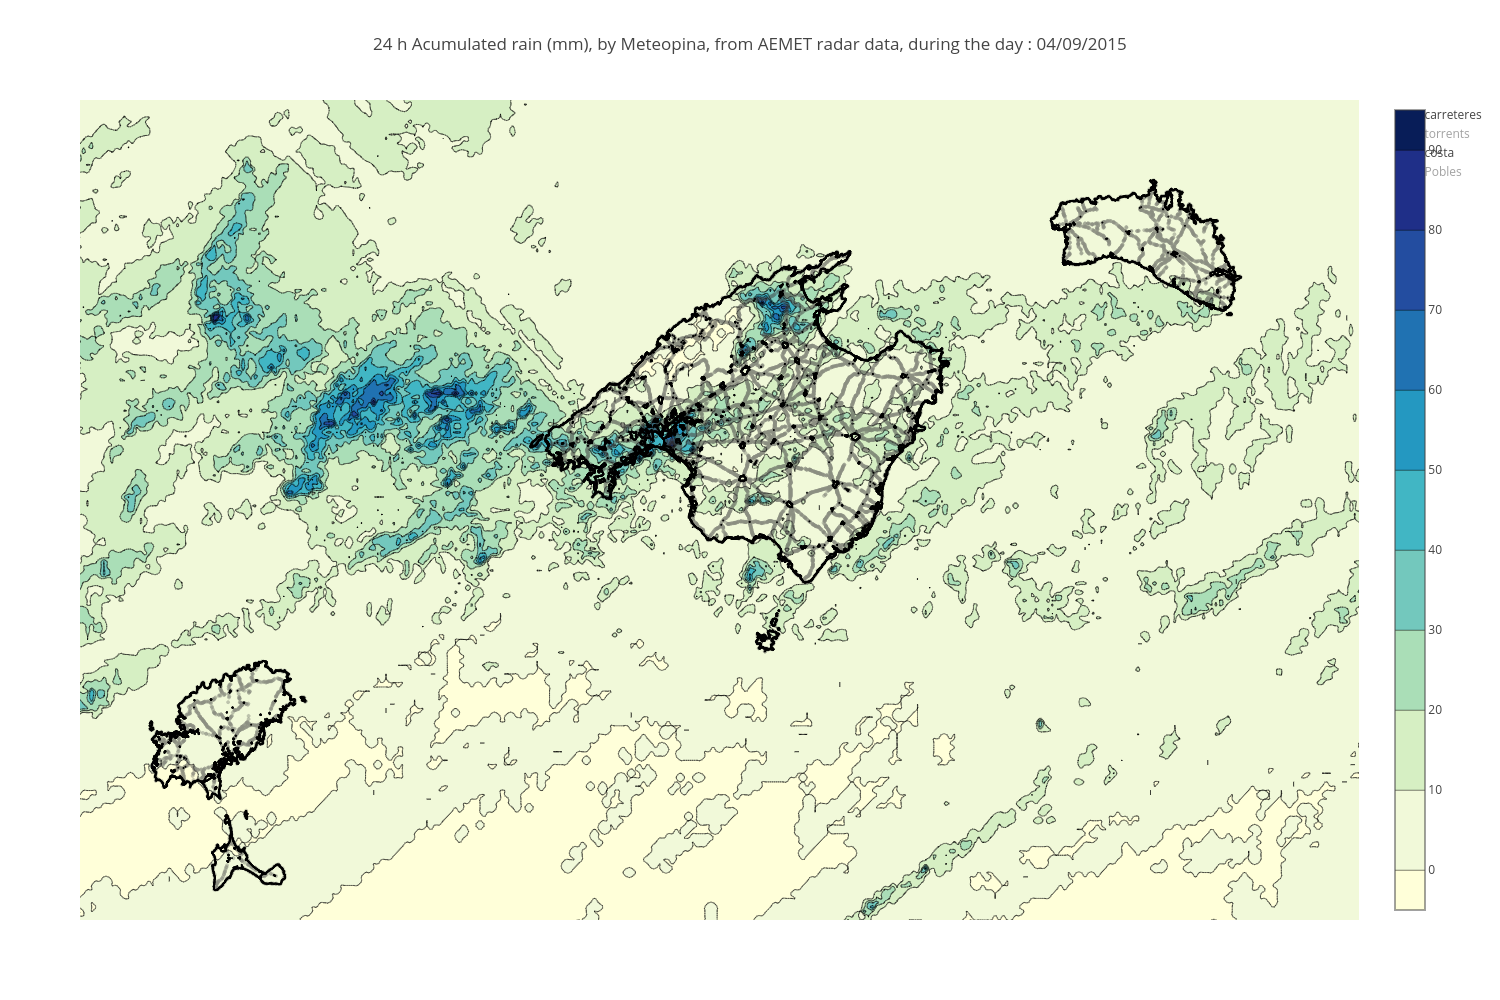
Tonibois's interactive graph and data of "24 h Acumulated rain (mm), by Meteopina, from AEMET radar data, during the day : 04/09/2015" is a scatter chart, showing carreteres, torrents, costa, Pobles, Precipitacio_contorn. The x-axis shows values from 87.15145754119143 to 400. The y-axis shows values from 330 to 140.