Edit chart
Loading graph
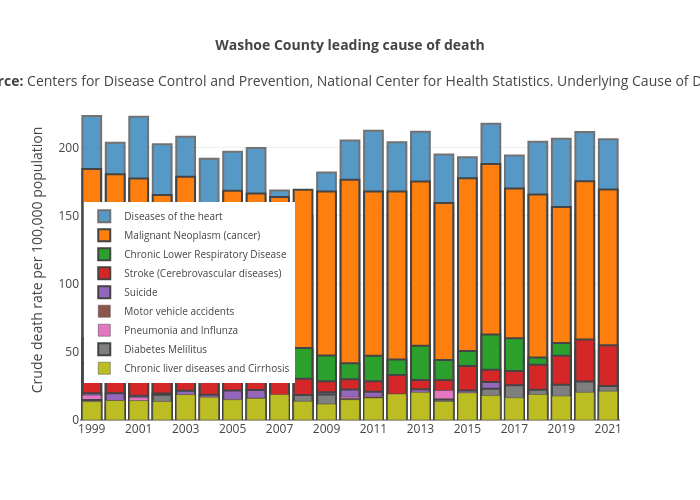
Truckeemeadowstomorrow's interactive graph and data of "Washoe County leading cause of death Source: Centers for Disease Control and Prevention, National Center for Health Statistics. Underlying Cause of Death" is a overlaid bar chart, showing Diseases of the heart, Malignant Neoplasm (cancer), Chronic Lower Respiratory Disease, Stroke (Cerebrovascular diseases), Suicide, Motor vehicle accidents, Pneumonia and Influnza, Diabetes Melilitus, Chronic liver diseases and Cirrhosis; with Crude death rate per 100,000 population in the y-axis. The x-axis shows values from 1998.5 to 2021.5. The y-axis shows values from 0 to 234.73684210526315.