Edit chart
Loading graph
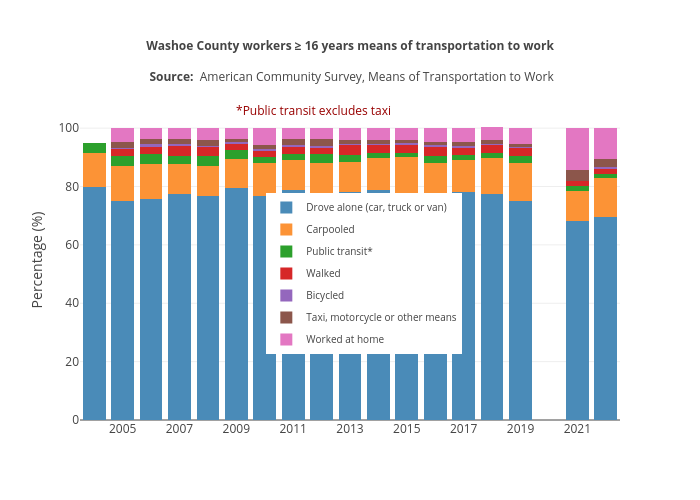
Truckeemeadowstomorrow's interactive graph and data of "Washoe County workers ≥ 16 years means of transportation to work Source: American Community Survey, Means of Transportation to Work" is a stacked bar chart, showing Drove alone (car, truck or van), Carpooled, Public transit*, Walked, Bicycled, Taxi, motorcycle or other means, Worked at home; with Percentage (%) in the y-axis. The x-axis shows values from 2003.5 to 2022.5. The y-axis shows values from 0 to 109.15044635522209. This visualization has the following annotation: *Public transit excludes taxi