Edit chart
Loading graph
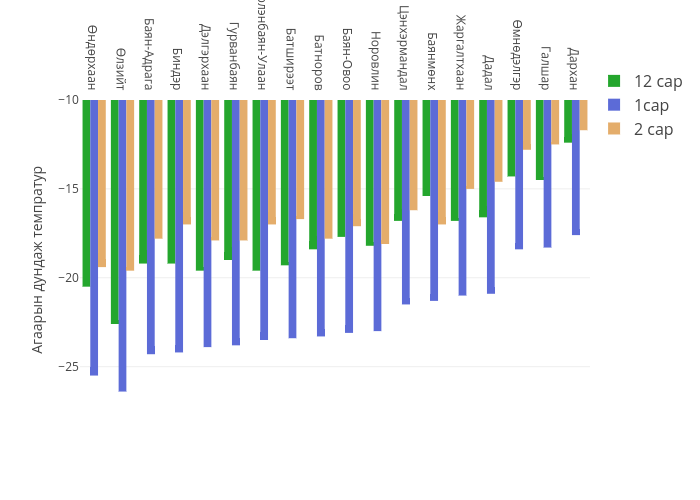
Tugsuutseden's interactive graph and data of "12 сар, 1сар, 2 сар" is a grouped bar chart, showing 12 сар, 1сар, 2 сар; with Агаарын дундаж темпратур in the y-axis. The x-axis shows values from -0.5 to 17.5. The y-axis shows values from -28 to -10.