Edit chart
Loading graph
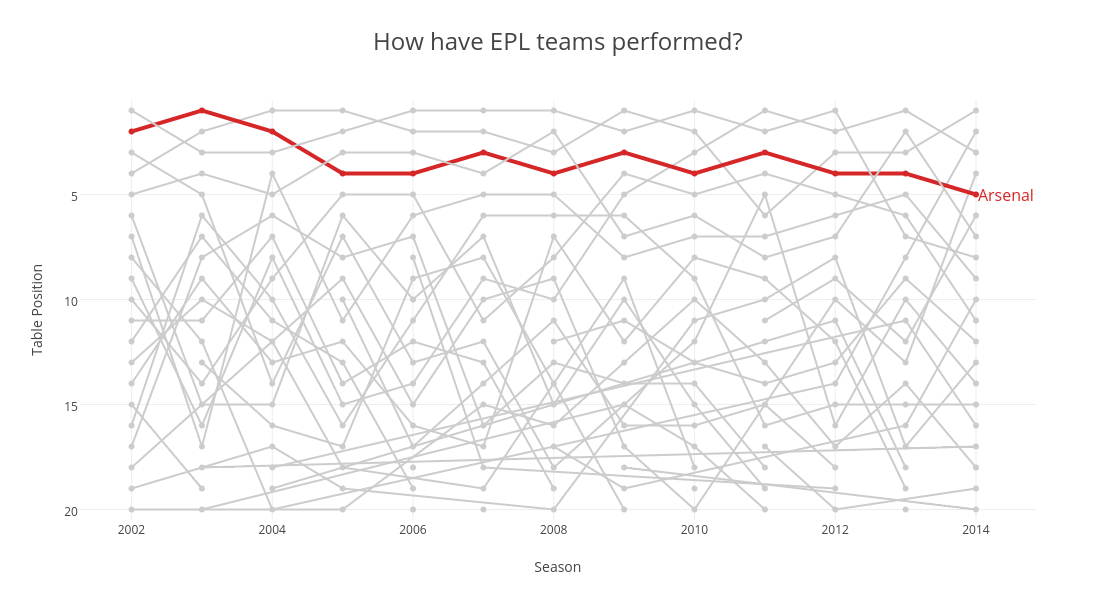
Vizwiz's interactive graph and data of "How have EPL teams performed?" is a scatter chart, showing Chelsea, Southampton, Manchester City, West Ham, Arsenal, Swansea City, Liverpool, Man United, Everton, Hull City, Tottenham, Stoke City, West Brom, Newcastle, Aston Villa, Crystal Palace, Leicester City, Sunderland, Burnley, QPR, Norwich, Fulham, Cardiff, Wigan, Reading, Bolton, Blackburn, Wolverhampton, Birmingham City, Blackpool, Portsmouth, Middlesbrough, Derby County, Sheffield United, Charlton Athletic, Watford, Leeds; with Season in the x-axis and Table Position in the y-axis.. The x-axis shows values from 2001.2665836741953 to 2014.8678641294682. The y-axis shows values from 20.5 to 0.5. This visualization has the following annotation: Arsenal