Edit chart
Loading graph
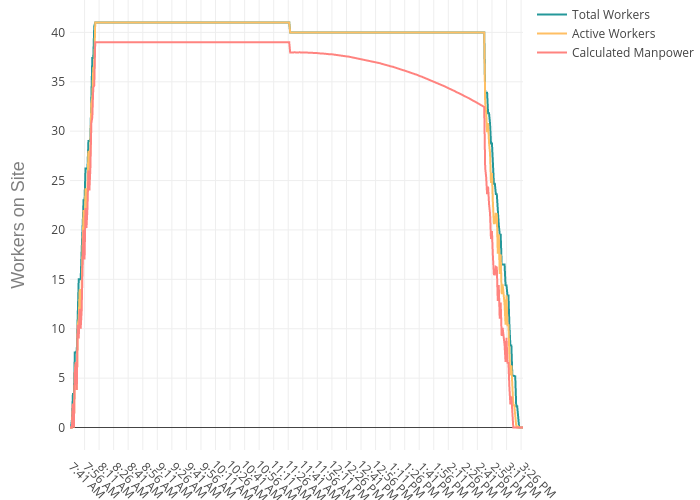
Workersense's interactive graph and data of "Total Workers, Active Workers, Calculated Manpower" is a scatter chart, showing Total Workers, Active Workers, Calculated Manpower; with Workers on Site in the y-axis. The x-axis shows values from 0 to 0. The y-axis shows values from 0 to 0.