Edit chart
Loading graph
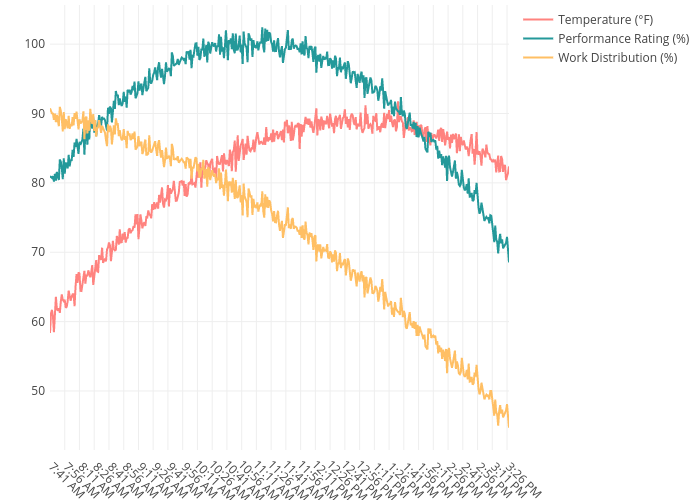
Workersense's interactive graph and data of "Temperature (°F), Performance Rating (%), Work Distribution (%)" is a scatter chart, showing Temperature (°F), Performance Rating (%), Work Distribution (%). The x-axis shows values from 0 to 0. The y-axis shows values from 0 to 0.