Edit chart
Loading graph
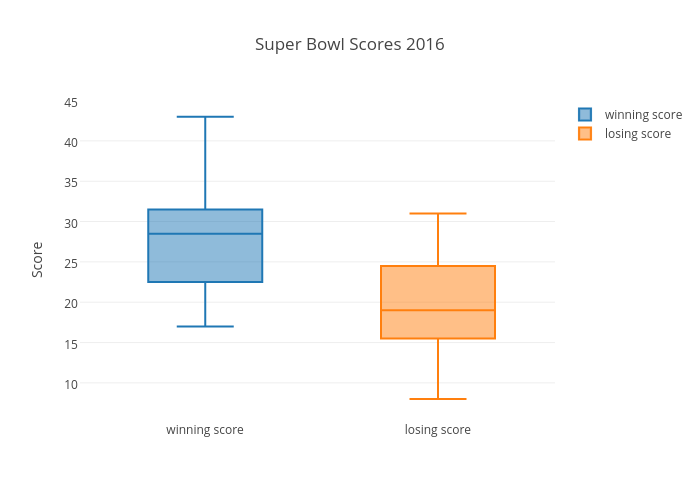
Yummymath's interactive graph and data of "Super Bowl Scores 2016" is a box plot, showing winning score vs losing score; with Score in the y-axis. The x-axis shows values from -0.5376626709253496 to 1.5027400091281669. The y-axis shows values from 5.394984543669537 to 45.0694811002657.