Edit chart
Loading graph
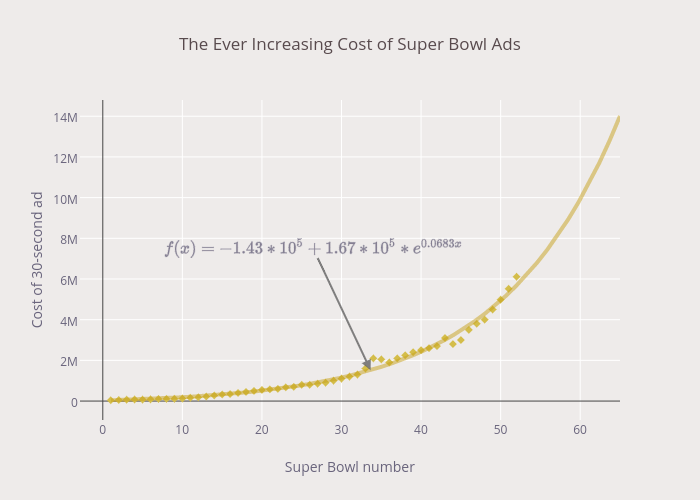
Yummymath's interactive graph and data of "The Ever Increasing Cost of Super Bowl Ads" is a scatter chart, showing Cost of 30-second ad vs Cost of 30-second ad - fit; with Super Bowl number in the x-axis and Cost of 30-second ad in the y-axis.. The x-axis shows values from -2.8308621636463487 to 65. The y-axis shows values from -1000101.9320165263 to 14801446.650542239. This visualization has the following annotation: $f(x) = -1.43*10^5 + 1.67*10^5*e^{0.0683x}$