Edit chart
Loading graph
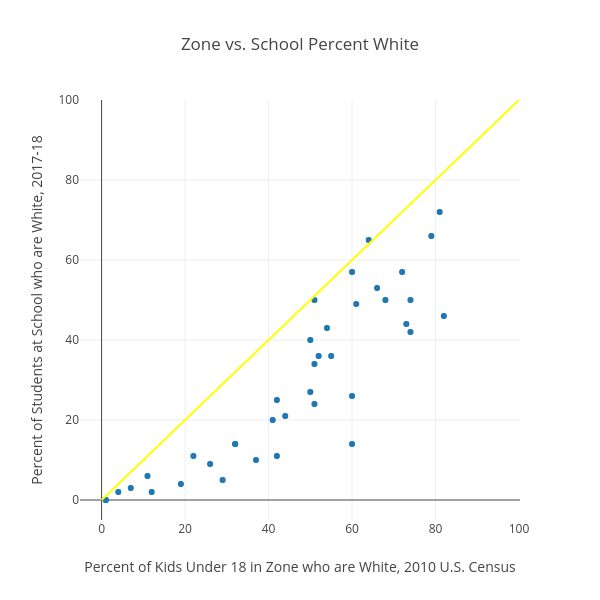
Zacharygoldstein's interactive graph and data of "Zone vs. School Percent White" is a scatter chart; with Percent of Kids Under 18 in Zone who are White, 2010 U.S. Census in the x-axis and Percent of Students at School who are White, 2017-18 in the y-axis.. The x-axis shows values from -5.168784029038113 to 100.23956442831216. The y-axis shows values from -5 to 100.