Edit chart
Loading graph
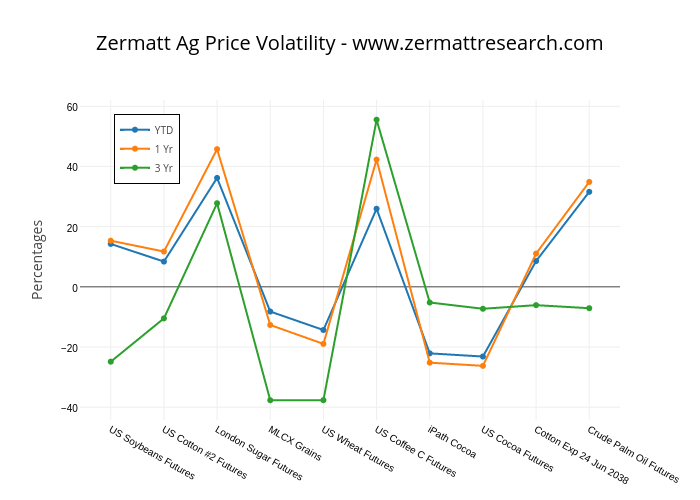
Zermattdata's interactive graph and data of "Zermatt Ag Price Volatility - www.zermattresearch.com" is a scatter chart, showing YTD, 1 Yr, 3 Yr; with Percentages in the y-axis. The x-axis shows values from -0.5391358797745773 to 9.539135879774577. The y-axis shows values from -43.90062828601472 to 61.73062828601472.