Edit chart
Loading graph
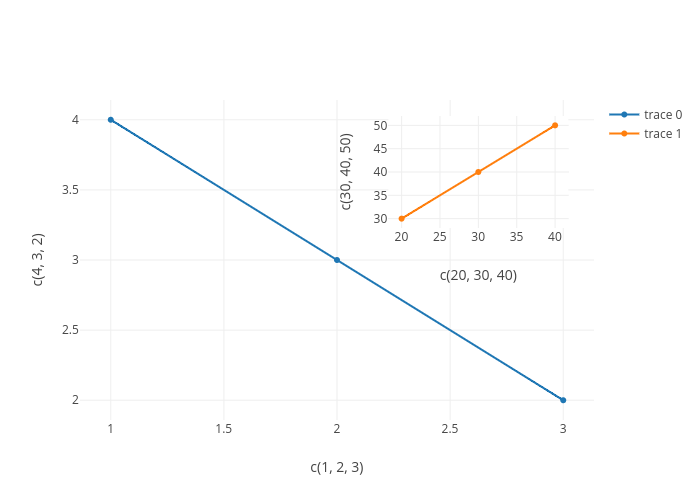
_statist_'s interactive graph and data of "c(4, 3, 2) vs c(1, 2, 3)" is a scatter chart; with c(1, 2, 3) in the x-axis and c(4, 3, 2) in the y-axis.. The x-axis shows values from 0 to 0. The y-axis shows values from 0 to 0.