Edit chart
Loading graph
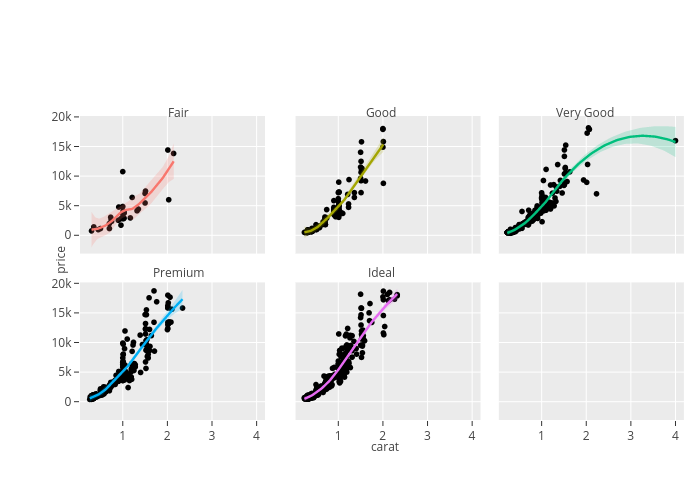
_statist_'s interactive graph and data of "None, None, None, None, None, Fair, Good, Very Good, Premium, Ideal, Fair, Good, Very Good, Premium, Ideal" is a scatter chart, showing None, None, None, None, None, Fair, Good, Very Good, Premium, Ideal, Fair, Good, Very Good, Premium, Ideal. The x-axis shows values from 0.0415 to 4.1885. The y-axis shows values from -3095.97437943871 to 20153.9652324726. This visualization has the following annotations: Fair; Good; Very Good; Premium; Ideal; carat; price