Edit chart
Loading graph
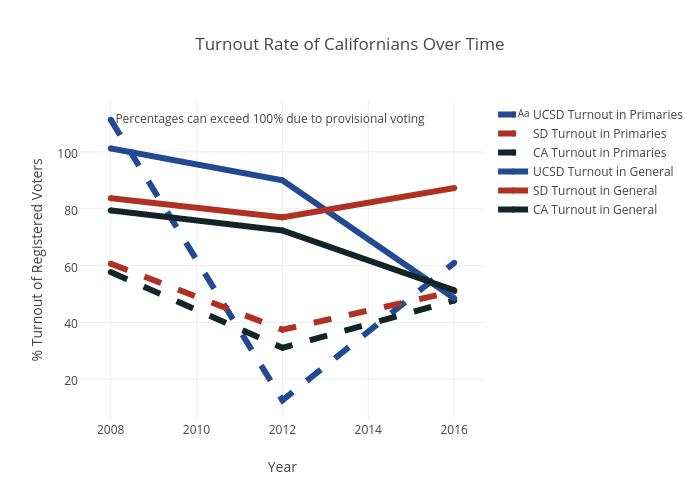
A6amin's interactive graph and data of "Turnout Rate of Californians Over Time" is a , showing UCSD Turnout in Primaries, SD Turnout in Primaries, CA Turnout in Primaries, UCSD Turnout in General, SD Turnout in General, CA Turnout in General; with Year in the x-axis and % Turnout of Registered Voters in the y-axis.. The x-axis shows values from 0 to 0. The y-axis shows values from 0 to 0.