Edit chart
Loading graph
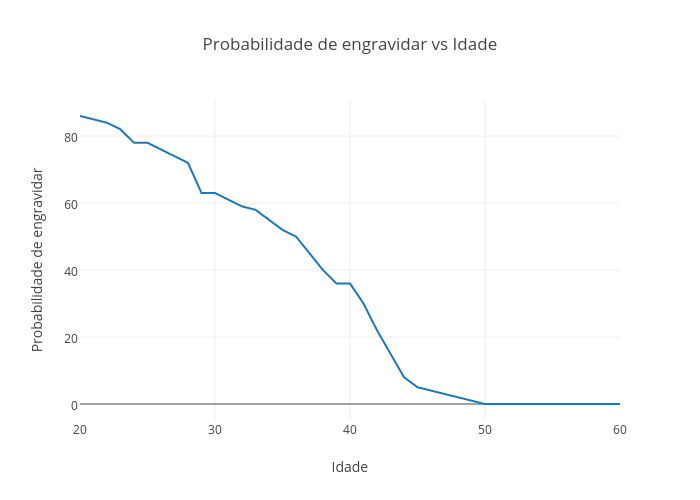
Aamato's interactive graph and data of "Probabilidade de engravidar vs Idade" is a line chart, showing B; with Idade in the x-axis and Probabilidade de engravidar in the y-axis.. The x-axis shows values from 20 to 60. The y-axis shows values from -4.777777777777777 to 90.77777777777777.