Edit chart
Loading graph
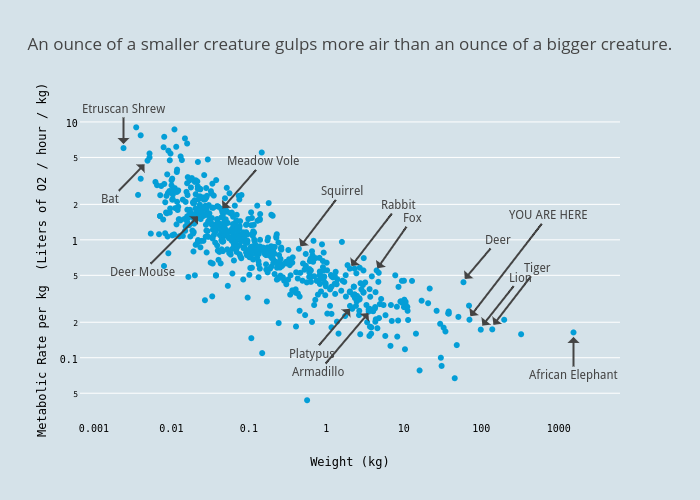
Aatish's interactive graph and data of "An ounce of a smaller creature gulps more air than an ounce of a bigger creature." is a scatter chart, showing Metabolic Rate per kg (Liters of O2 / hour / kg); with Weight (kg) in the x-axis and Metabolic Rate per kg (Liters of O2 / hour / kg) in the y-axis.. The x-axis shows values from -3.0487233614159743 to 3.6466006736099374. The y-axis shows values from -1.5149943233393786 to 1.108512075871814. This visualization has the following annotations: Etruscan Shrew; African Elephant; YOU ARE HERE; Meadow Vole; Platypus; Rabbit; Bat; Squirrel; Lion; Tiger; Armadillo; Deer; Fox; Deer Mouse