Edit chart
Loading graph
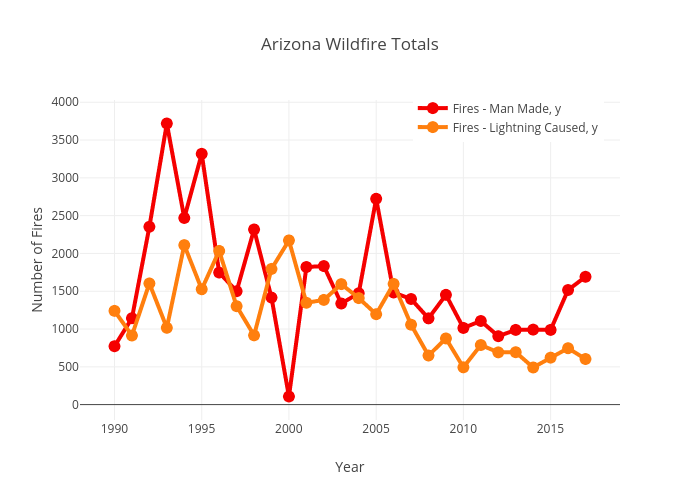
Abc15data's interactive graph and data of "Arizona Wildfire Totals" is a line chart, showing Fires - Man Made, y vs Fires - Lightning Caused, y; with Year in the x-axis and Number of Fires in the y-axis.. The x-axis shows values from 1988.3267898383372 to 2018.6732101616628. The y-axis shows values from -139.27272727272728 to 3965.2727272727275.