Edit chart
Loading graph
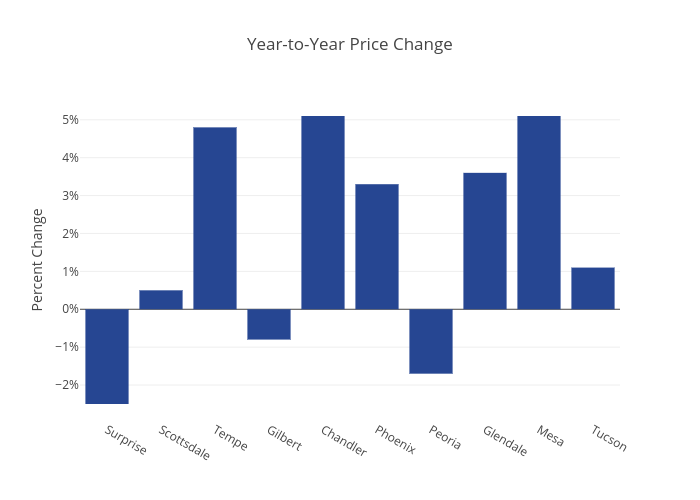
Abc15data's interactive graph and data of "Year-to-Year Price Change" is a bar chart, showing E; with Percent Change in the y-axis. The x-axis shows values from -0.5 to 9.5. The y-axis shows values from -2.922222222222222 to 5.522222222222222.