Edit chart
Loading graph
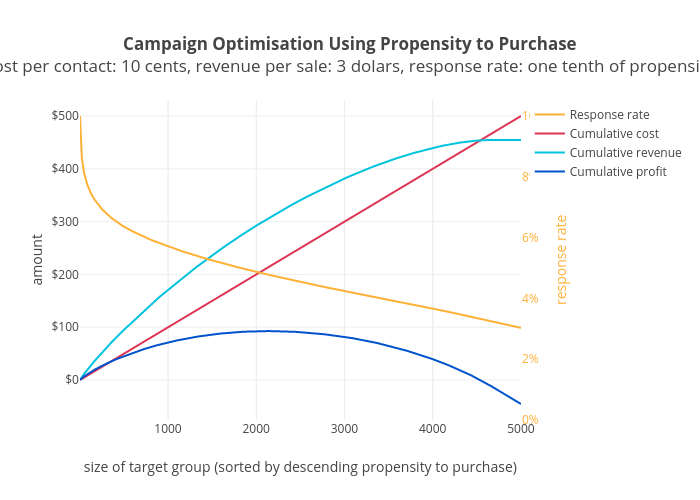
Adamvotava's interactive graph and data of "Campaign Optimisation Using Propensity to Purchasecost per contact: 10 cents, revenue per sale: 3 dolars, response rate: one tenth of propensity" is a scatter chart, showing Response rate, Cumulative cost, Cumulative revenue, Cumulative profit; with size of target group (sorted by descending propensity to purchase) in the x-axis and amount in the y-axis.. The x-axis shows values from 0 to 0. The y-axis shows values from 0 to 0.