Edit chart
Loading graph
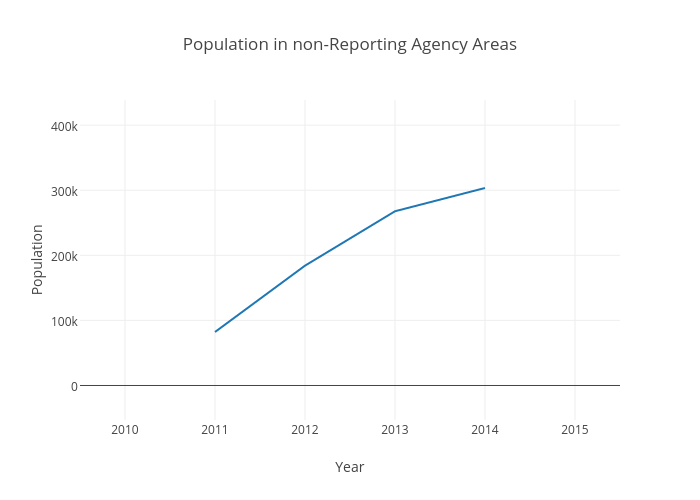
Adcrosby's interactive graph and data of "Population in non-Reporting Agency Areas" is a line chart, showing A; with Year in the x-axis and Population in the y-axis.. The x-axis shows values from 2009.5 to 2015.5. The y-axis shows values from -53023.388888888876 to 438574.3888888889.