Edit chart
Loading graph
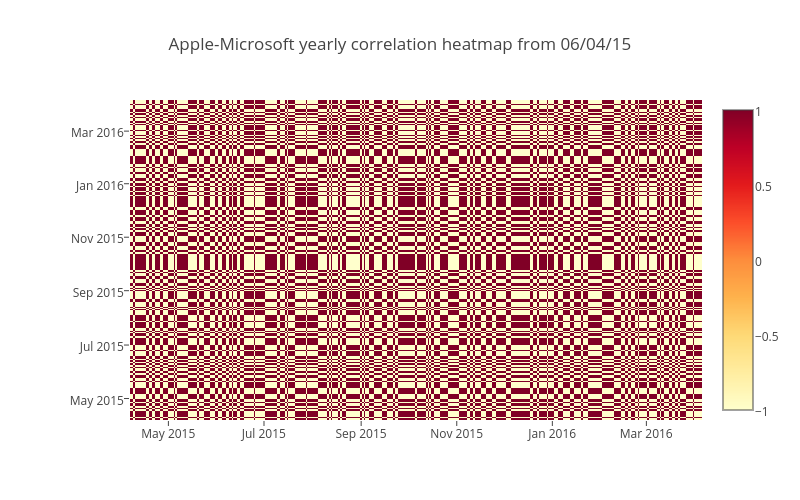
Affinito's interactive graph and data of "Apple-Microsoft yearly correlation heatmap from 06/04/15" is a heatmap. The x-axis shows values from 0 to 0. The y-axis shows values from 0 to 0.