Edit chart
Loading graph
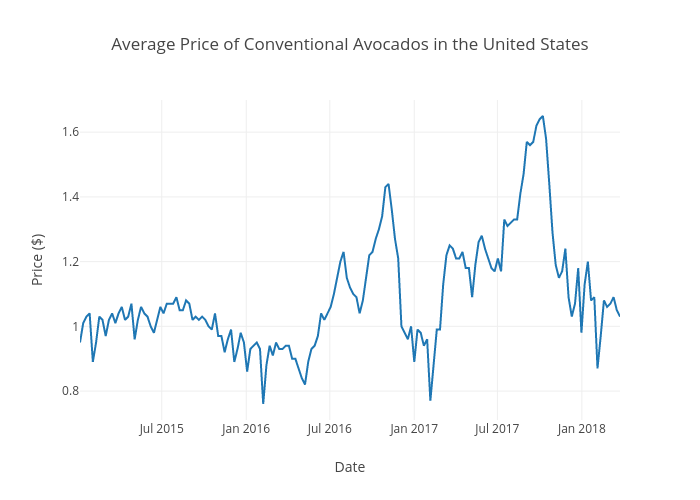
Aggieed97's interactive graph and data of "Average Price of Conventional Avocados in the United States" is a line chart, showing Average Price; with Date in the x-axis and Price ($) in the y-axis.. The x-axis shows values from 2015-01-04 to 2018-03-25. The y-axis shows values from 0.7105555555555556 to 1.6994444444444443.