Edit chart
Loading graph
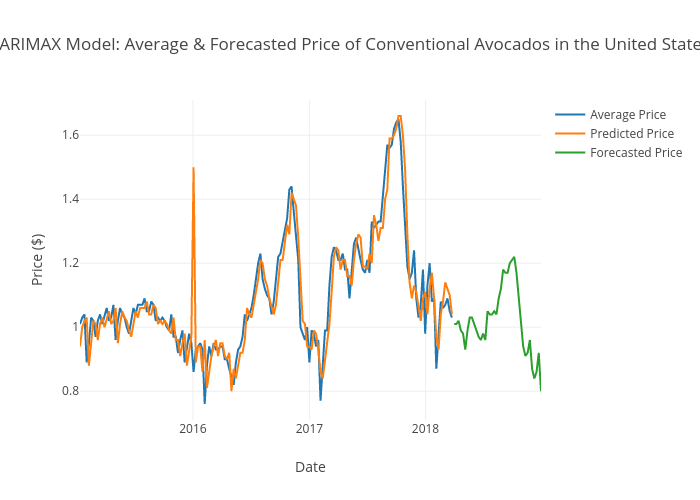
Aggieed97's interactive graph and data of "SARIMAX Model: Average & Forecasted Price of Conventional Avocados in the United States" is a line chart, showing Average Price, Predicted Price, Forecasted Price; with Date in the x-axis and Price ($) in the y-axis.. The x-axis shows values from 2015-01-11 to 2018-12-30. The y-axis shows values from 0.71 to 1.71.