Edit chart
Loading graph
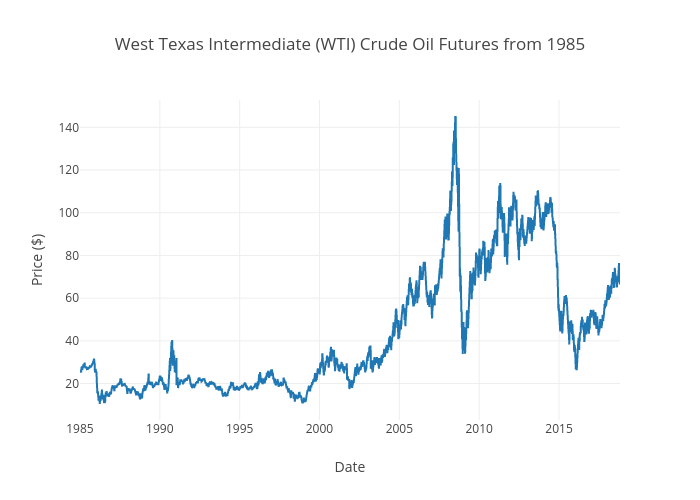
Aggieed97's interactive graph and data of "West Texas Intermediate (WTI) Crude Oil Futures from 1985" is a line chart; with Date in the x-axis and Price ($) in the y-axis.. The x-axis shows values from 1985-01-02 to 2018-10-26. The y-axis shows values from 2.9272222222222233 to 152.78277777777777.