Edit chart
Loading graph
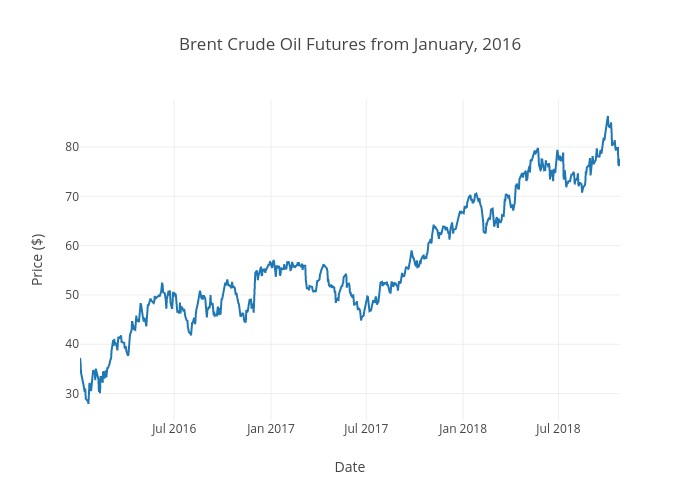
Aggieed97's interactive graph and data of "Brent Crude Oil Futures from January, 2016" is a line chart; with Date in the x-axis and Price ($) in the y-axis.. The x-axis shows values from 2016-01-04 to 2018-10-26. The y-axis shows values from 24.634999999999998 to 89.53500000000001.