Edit chart
Loading graph
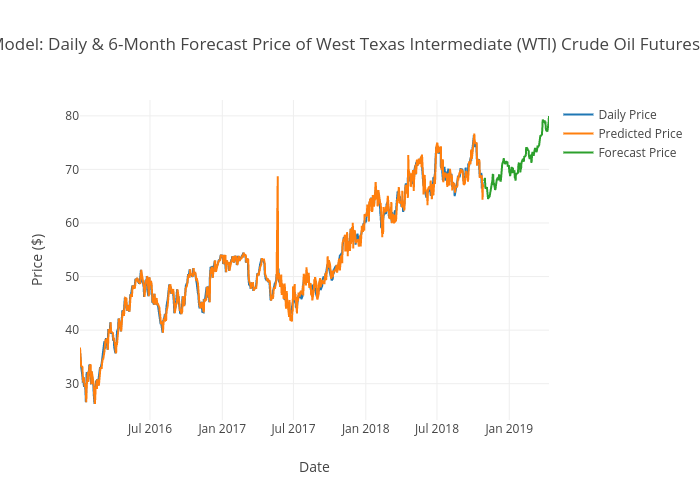
Aggieed97's interactive graph and data of "SARIMAX Model: Daily & 6-Month Forecast Price of West Texas Intermediate (WTI) Crude Oil Futures from 2016" is a line chart, showing Daily Price, Predicted Price, Forecast Price; with Date in the x-axis and Price ($) in the y-axis.. The x-axis shows values from 2016-01-05 to 2019-04-12. The y-axis shows values from 23.223333333333336 to 82.95666666666666.