Edit chart
Loading graph
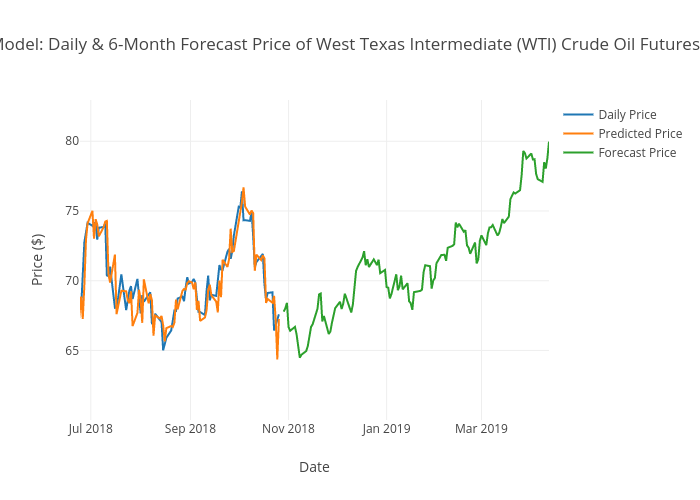
Aggieed97's interactive graph and data of "SARIMAX Model: Daily & 6-Month Forecast Price of West Texas Intermediate (WTI) Crude Oil Futures from 2016" is a line chart, showing Daily Price, Predicted Price, Forecast Price; with Date in the x-axis and Price ($) in the y-axis.. The x-axis shows values from 2018-06-24 06:44:40.292 to 2019-04-12. The y-axis shows values from 60.013270440251574 to 82.95666666666666.