Edit chart
Loading graph
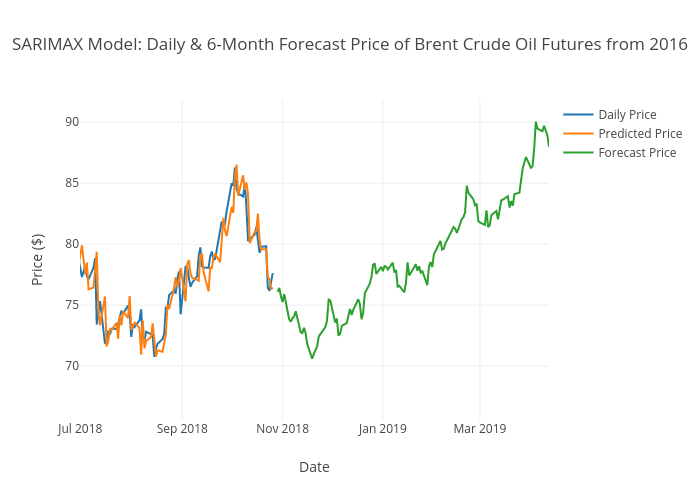
Aggieed97's interactive graph and data of "SARIMAX Model: Daily & 6-Month Forecast Price of Brent Crude Oil Futures from 2016" is a line chart, showing Daily Price, Predicted Price, Forecast Price; with Date in the x-axis and Price ($) in the y-axis.. The x-axis shows values from 2018-06-30 19:29:20.5839 to 2019-04-12. The y-axis shows values from 65.57486822401916 to 91.8281476489967.