Edit chart
Loading graph
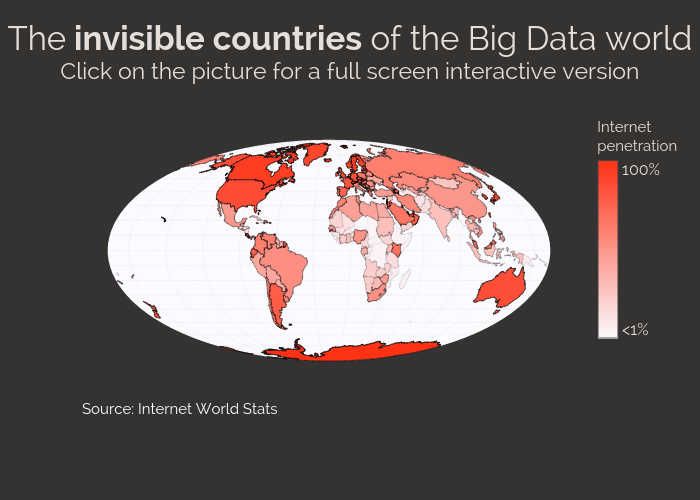
Agostontorok's interactive graph and data of "The invisible countries of the Big Data worldClick on the picture for a full screen interactive version" is a choropleth. The x-axis shows values from 0 to 0. The y-axis shows values from 0 to 0. This visualization has the following annotation: Source: Internet World Stats