Edit chart
Loading graph
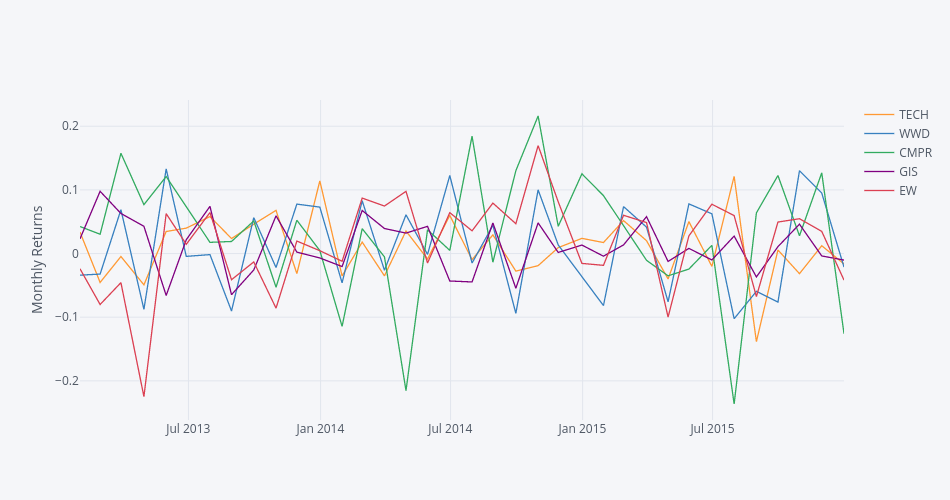
Ahmedas91's interactive graph and data of "TECH, WWD, CMPR, GIS, EW" is a line chart, showing TECH, WWD, CMPR, GIS, EW; with Monthly Returns in the y-axis. The x-axis shows values from 1359579600000 to 1451509200000. The y-axis shows values from -0.26156066332984423 to 0.2412175004019402.