Edit chart
Loading graph
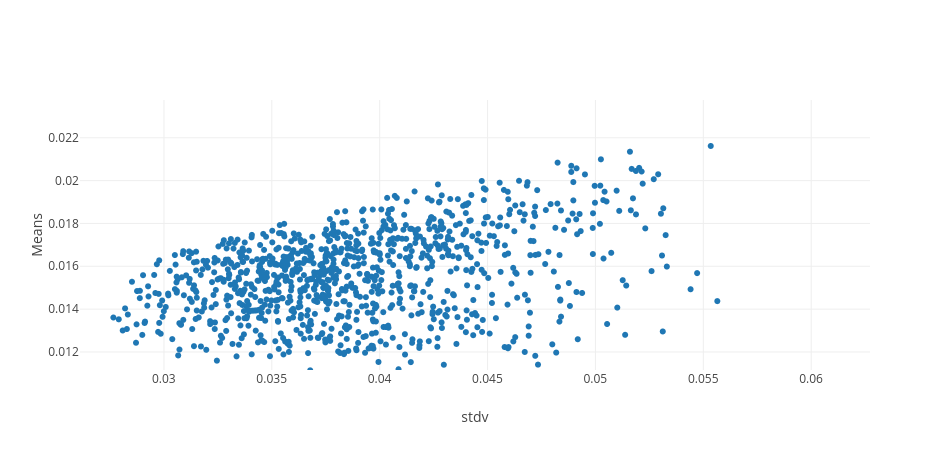
Ahmedas91's interactive graph and data of "Means vs stdv" is a scatter chart, showing Random Portfolio; with stdv in the x-axis and Means in the y-axis.. The x-axis shows values from 0.026109999017671935 to 0.06272554059056512. The y-axis shows values from 0.0111592183712363 to 0.02376187502129784.