Edit chart
Loading graph
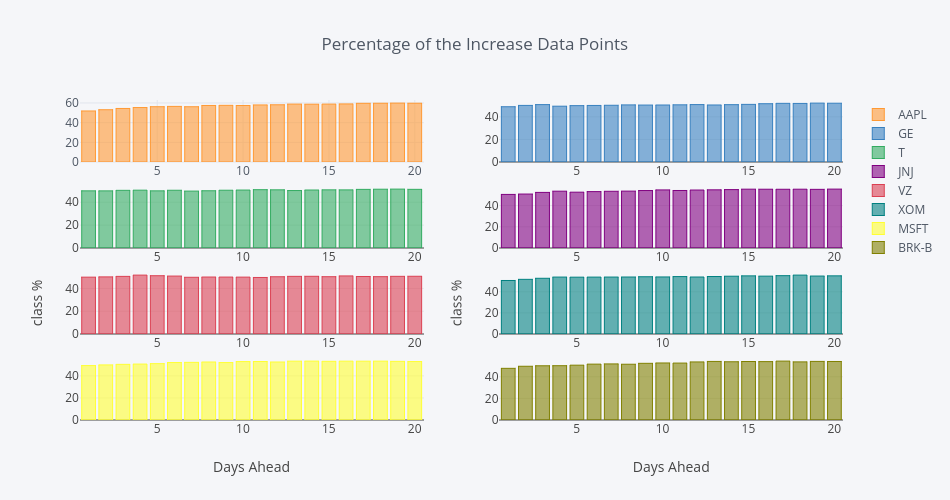
Ahmedas91's interactive graph and data of "Percentage of the Increase Data Points" is a bar chart, showing AAPL, GE, T, JNJ, VZ, XOM, MSFT, BRK-B. The x-axis shows values from 0.5 to 20.5. The y-axis shows values from 0 to 62.980692319998035.