Edit chart
Loading graph
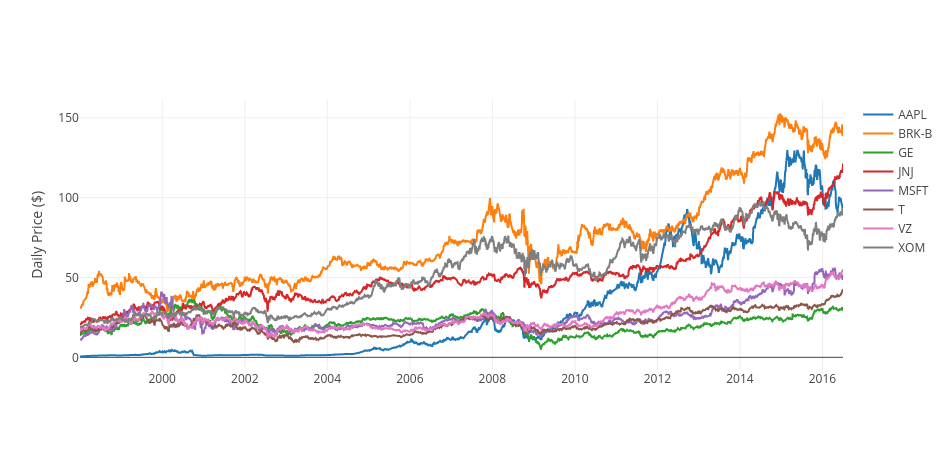
Ahmedas91's interactive graph and data of "Daily Price ($) vs time" is a scatter chart, showing AAPL, BRK-B, GE, JNJ, MSFT, T, VZ, XOM; with time in the x-axis and Daily Price ($) in the y-axis.. The x-axis shows values from 883688400000 to 1467234000000. The y-axis shows values from -7.930791111111111 to 161.12267111111112.