Edit chart
Loading graph
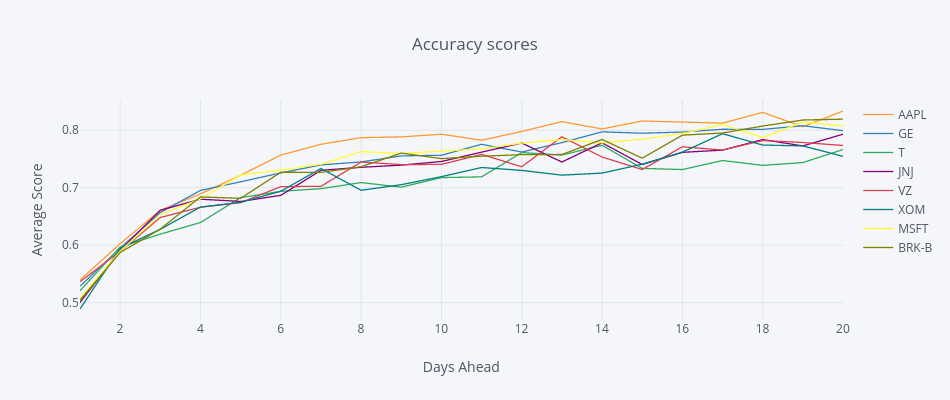
Ahmedas91's interactive graph and data of "Accuracy scores" is a line chart, showing AAPL, GE, T, JNJ, VZ, XOM, MSFT, BRK-B; with Days Ahead in the x-axis and Average Score in the y-axis.. The x-axis shows values from 1 to 20. The y-axis shows values from 0.4698338525441329 to 0.852596053997923.