Edit chart
Loading graph
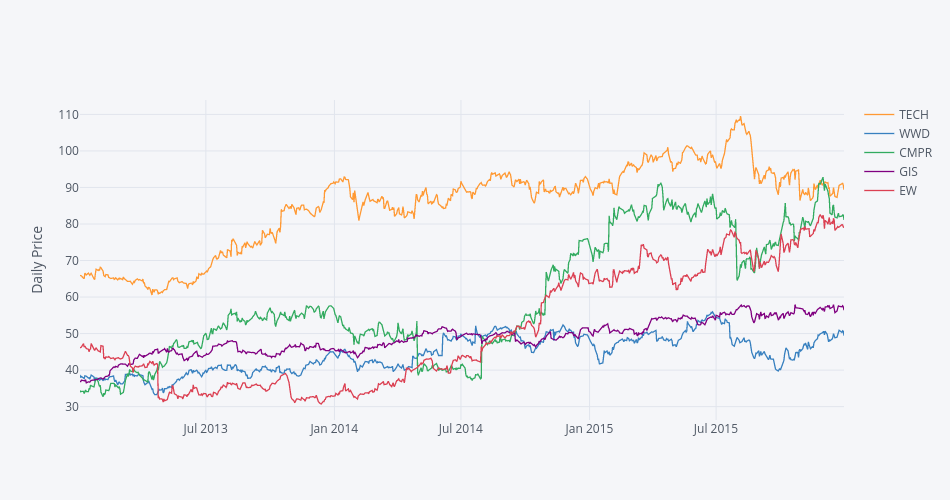
Ahmedas91's interactive graph and data of "TECH, WWD, CMPR, GIS, EW" is a line chart, showing TECH, WWD, CMPR, GIS, EW; with Daily Price in the y-axis. The x-axis shows values from 1357074000000 to 1451509200000. The y-axis shows values from 26.339695777777777 to 113.94576022222223.