Edit chart
Loading graph
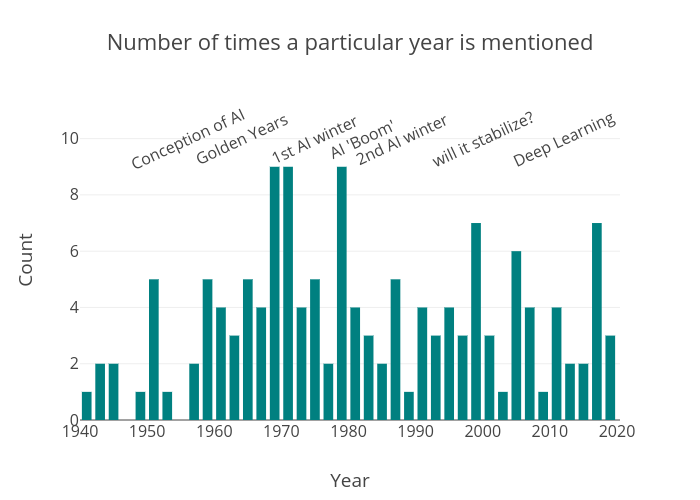
Akira70000's interactive graph and data of "Number of times a particular year is mentioned" is a histogram, showing # mentions; with Year in the x-axis and Count in the y-axis.. The x-axis shows values from 0 to 0. The y-axis shows values from 0 to 0. This visualization has the following annotations: Conception of AI; Golden Years; 1st AI winter; AI 'Boom'; 2nd AI winter; will it stabilize?; Deep Learning