Edit chart
Loading graph
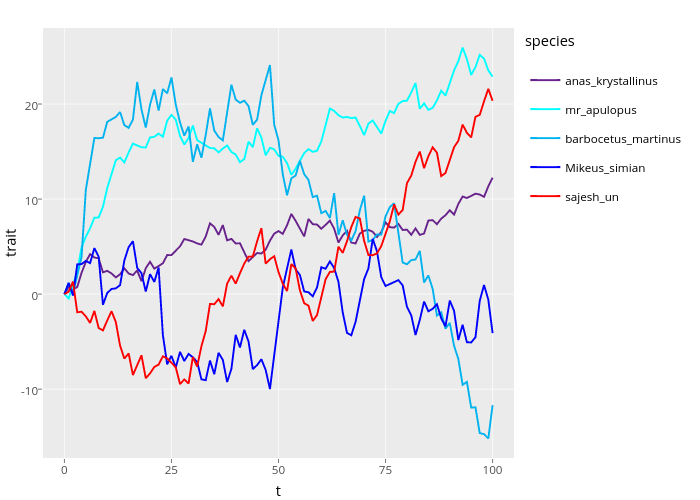
Akrystalli's interactive graph and data of "trait vs t" is a line chart, showing anas_krystallinus, mr_apulopus, barbocetus_martinus, Mikeus_simian, sajesh_un; with t in the x-axis and trait in the y-axis.. The x-axis shows values from -5 to 105. The y-axis shows values from -17.2424644379579 to 27.9978199243494. This visualization has the following annotation: species