Edit chart
Loading graph
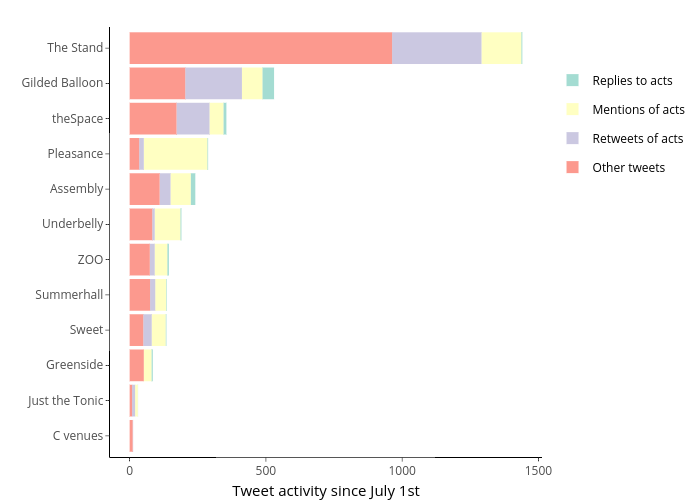
Alasdair_sykes's interactive graph and data of "Replies to acts, Mentions of acts, Retweets of acts, Other tweets" is a , showing Replies to acts, Mentions of acts, Retweets of acts, Other tweets; with Tweet activity since July 1st in the x-axis. The x-axis shows values from -72.05 to 1513.05. The y-axis shows values from 0.4 to 12.6.